Simulation of a Protein Signaling Perceptron
A principle mechanism in signaling transduction is the multi-layer kinase cascade. Uri Alon* presents a toy model of this mechanism based on a multi-layer perceptrion. This structure, illustrated below is characteristic of the network motifs (bi-fan and diamond) that are typical of signaling cascades found in nature.

I implemented an ODE-based simulation of this system in R, making use of the deSolve package to solve the ODEs and igraph package as a data structure.
My goal was not just to simulate the trajectories of the nodes in the system, but to simulate a typical proteomics dataset by repeatly simulating trajectories, and in each case taking a single point from steady state and using it as a single observation in a dataset. In other words, I wanted to simulate multiple single timepoint “snapshots” of the dynamic system. In taking 1000s of such observations, one can simulate single cell dataset. In taking the averages for a given node, one can simulate a sample in a bulk proteomics dataset.
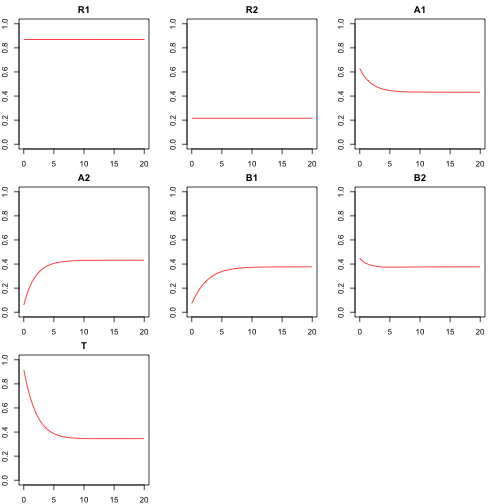
There are two inputs to the cascade, “R1” and “R2”, and on output “T”. The simulation of a signaling cascade is conducted by viewing each node as a protein that is either activated or inactivated. The value for each node is the proportion of activated protein over the total amount of the protein. Data is simulated by using random (uniform 0, 1) inputs for R1 and R2 (when the inputs are at low levels, the pathway will be inactivated). The levels of R1 and R2 do not degrade (are constant). Each subsequent layer is modeled using ODEs with first order kinetics , where the rate of change in amount of activated protein is determined by the amount of unactivated and the amount of activated proteins in the previous layer and and rate parameters and (analogous to a double phosphorylation), as well as rate of deactivation (analogous to the presence of phosphotase). An example time course of a system with 2 middles layer looks like this:
Targeted interventions are included in the simulation. These are used to test methods designed to learn the causal relationships between the nodes. This is simulated by fixing the activation rate for a given node to be 0. This forces proportion of the protein in active state to degrade to 0 in steady state, assuming the rate of deactivation is non-zero. This is analogous to use of an inhibitor that blocks the phosphorylation of a given protein.
References
*Alon, Uri. An introduction to systems biology: design principles of biological circuits. CRC press, 2006.